Tuesday, November 20, 2018

Creek Critters App from Audubon Naturalist Society


A new app from the Audubon Naturalist Society:  Creek Critters walks users through finding and identifying the small organisms that live in freshwater streams, and generating stream health reports based on what they find. It’s available in the Apple App Store or in Google Play.


Monday, October 15, 2018

Loss of insects?


www.washingtonpost.com

washingtonpost.com

‘Hyperalarming’ study shows massive insect loss


The emerald anole, one of the main insect eaters in the Luquillo forest of Puerto Rico. (Brad Lister/PNAS)
Insects around the world are in a crisis, according to a small but growing number of long-term studies showing dramatic declines in invertebrate populations. A new report suggests that the problem is more widespread than scientists realized. Huge numbers of bugs have been lost in a pristine national forest in Puerto Rico, the study found, and the forest’s insect-eating animals have gone missing, too.
In 2014, an international team of biologists estimated that, in the past 35 years, the abundance of invertebrates such as beetles and bees had decreased by 45 percent. In places where long-term insect data are

Saturday, September 29, 2018

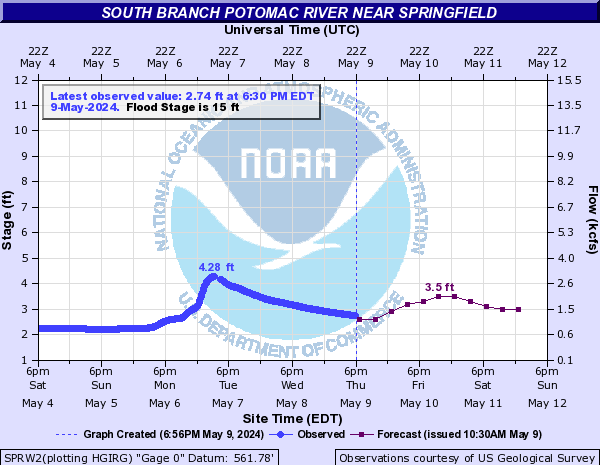
Monitoring and publishing streamflow and flooding using NOAA gauges


You can go to the NOAA Weather Service Rivers page, then zoom in to look for a specific gauge:


Not all gauges provide predictive data, which require models built on anticipated precipitation and past precipitation impact models, integrated with upstream gauge data if available. You'll typically see a full week, including 5 days of past streamflow and gauge height, and a prediction for the next two days.


The images on these pages are dynamic, so if you visit this blog post later, you'll see the data in the image above is changing.  In order to capture an image of a flood event, you'll want to right-click the image and copy it or save it.

Tuesday, September 25, 2018

Cloudiest and Rainiest September?

from the Washington Post's Capital Weather Gang

One of D.C.'s cloudiest and rainiest Septembers keeps getting worse

2018 is in the running for the wettest year on record


Washington has had 20 more inches of rain than normal since April and over five inches more than normal in September. (National Weather Service)


We have all kinds of stats that confirm what is obvious to Washingtonians: This month is one of the cloudiest and wettest Septembers the District has ever seen. The month is doing more than its fair share to put 2018 in the running for Washington’s wettest year on record.

You’re forgiven if you’re fed up with it.

“I would pay so much money for it to never, ever rain again,” tweeted Carly Cloud.
“This is awful!” added Lisa Dunn on Twitter.

September by the numbers

Through Sunday, Washington had posted 8.25 inches of rain for the month, which is 5.44 inches above normal and ranks fifth-most on record (through Sept. 23).

Rain falling early this week could easily push that number over nine or even 10 inches.

Washington’s rainiest September on record occurred in 1934, when an astonishing 17.45 inches fell. That record is safe, and the second-place total of 12.36 inches from 1975 probably is, too. But a top-five finish above 8.84 inches (from 2011) seems like a good bet this year. 

The rain this month has been both persistent and, at times, heavy. We’ve registered at least a trace of rain on 17 of 24 days and measurable amounts on 12 days. At least an inch has fallen three times (Sept. 7, 9 and 17).

Even on days when it hasn’t rained, stuck weather systems have frequently cast a bleak shadow over

Friday, September 14, 2018

Leaf color changes

As your expertise grows, and others' awareness of your career grows, leaf color explanation will be an annual event (I'm betting it is already for some of you).

Like temperature and sunlight, soil moisture also plays a role in how the leaves will appear this fall.  As day length gets shorter after the equinox (September 22), cells in each leaf create a layer that prevents new chlorophyll (it's called the abscission layer).   Severe drought causes the abscission layer to form earlier and leaves often dry up or drop before they change color. Heavy rain and wind can cause the leaves to fall before they fully develop color.

The best color scenario is a growing season with plenty of moisture followed by a dry, cool and sunny autumn with warm days and cool but frost-free nights.   

No automatic alt text available.

Sunday, September 9, 2018

Drone footage of North Branch flooding

My wife and I run a research farm along the South Branch of the Potomac between Green Spring, WV and Levels, WV, just upstream of where the mainstem of the Potomac begins (confluence of the North Branch and the South Branch) near Oldtown Maryland.

A company called Ripple Effect Drone Services began producing videos of the Potomac river this year that captured the impact of the flooding and revealed the flood plains.

I expect you can see this without having a Facebook account:

https://www.facebook.com/pg/rippleeffectdrone/videos/

Wednesday, August 22, 2018

Stream Flow and Flood Data - August 2018

From Virginia Water Central News Grouper

Virginia Precipitation and Stream Flow for the 7-day Period Ending August 20, 2018, Plus an Overview of Flooding Nationwide

by araflo
Below are several items summarizing recent precipitation and stream flow:
  1. Images showing precipitation in Virginia and other areas of the United States for the period, and stream flow in Virginia, over the seven-day period ending August 20, 2018 (information available as of August 21).
  2. Flooding overview maps for Virginia and nationwide, as of August 21.
The Virginia Water Resources Research Center thanks the agencies mentioned below for providing precipitation and stream-flow information and images. For the current month’s other weekly reports on stream flow and precipitation, please see the News Grouper posts available at this link: https://vawatercentralnewsgrouper.wordpress.com/?s=Virginia+Precipitation.
For monthly reviews of precipitation, stream flow, and drought, please see the posts available at this link: http://vawatercentralnewsgrouper.wordpress.com/?s=Monthly+Water+Status.
For more information on current and historical surface-water and groundwater conditions in Virginia, please see the U.S. Geological Survey (USGS) Virginia and West Virginia Science Center’s Web site, see https://www.usgs.gov/centers/va-wv-water.

Sunday, August 19, 2018

Welcome to the Virginia Tech Watershed Stewardship Blog

Welcome to our Fall 2018 Virginia Tech Watershed Stewardship Course.  Our Course Overview (what would normally be called a Syllabus before Canvas came along) is available at https://goo.gl/i1JgvM (Links to an external site.)Links to an external site. .  

See both the Canvas list of Weekly Modules and Assignments, and the Canvas Course Syllabus (in order by due date - a handy feature).  I'm vulnerable to making lots of mistakes in aligning these three documents - please let me know if something seems wrong.  Thanks in advance for being alert readers!
I requested an ArcGIS online account for all of you.  You will all get an email from VT 4-Help before Labor Day providing you with free access to ArcGIS Online.  You are not obliged to use it if other tools meet your needs, but you'll be glad to have tried it.
Email or call if you have questions.