
Virginia Precipitation and Stream Flow for the 7-day Period Ending August 20, 2018, Plus an Overview of Flooding Nationwideby araflo |
Below are several items summarizing recent precipitation and stream flow:
- Images showing precipitation in Virginia and other areas of the United States for the period, and stream flow in Virginia, over the seven-day period ending August 20, 2018 (information available as of August 21).
- Flooding overview maps for Virginia and nationwide, as of August 21.
The Virginia Water Resources Research Center thanks the agencies mentioned below for providing precipitation and stream-flow information and images. For the current month’s other weekly reports on stream flow and precipitation, please see the News Grouper posts available at this link: https://
For monthly reviews of precipitation, stream flow, and drought, please see the posts available at this link: http://
For more information on current and historical surface-water and groundwater conditions in Virginia, please see the U.S. Geological Survey (USGS) Virginia and West Virginia Science Center’s Web site, see https://www.usgs.gov/centers/

August 2018 Gaging Station of the Month: North Fork Rivanna River near Earlysville on County Route 649 in Albemarle County, July 22, 2013. U.S. Geological Survey information from this gage is online at https://waterdata.usgs.gov/va/
Precipitation
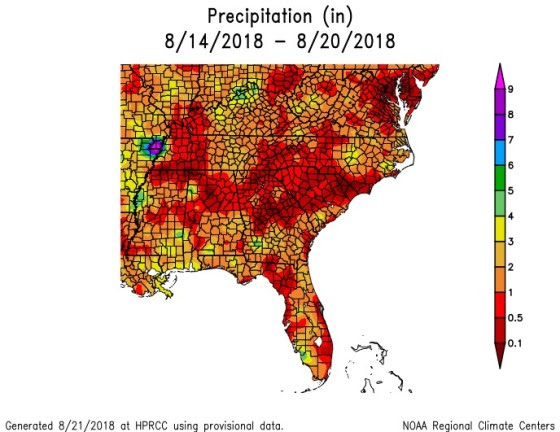
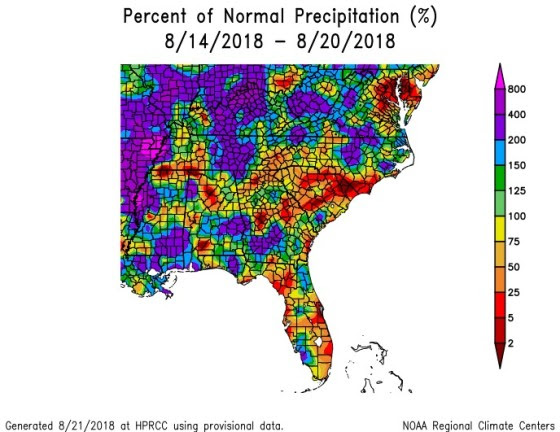
The following two color-coded maps show southeastern U.S. precipitation amounts (top map) and the percent of normal precipitation compared to normal for this period of the year (bottom map) over the seven-day period ending August 20, 2018. As of that date, these data were provisional (needing to be verified for accuracy and subject to possible revision). The maps were accessed from the High Plains Regional Climate Center, located at the University of Nebraska in Lincoln, online at https://hprcc.unl.edu/maps.
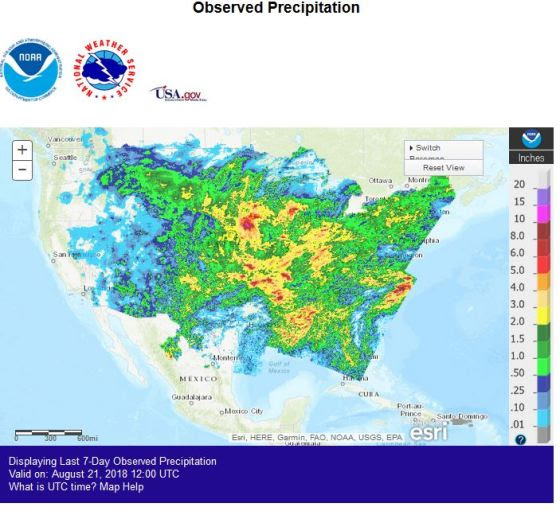
Another source of precipitation data is the National Weather Service’s Advanced Hydrologic Prediction Service, online at http://water.weather.gov/
Stream Flow
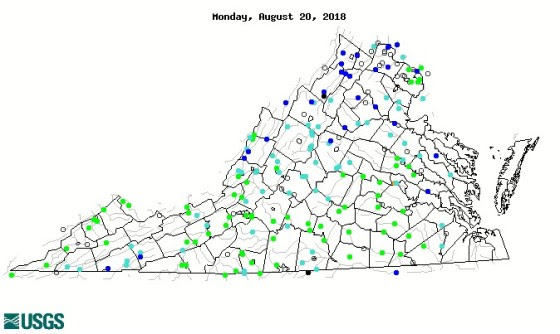
Seven-day-average stream flows at Virginia gaging stations as of August 20, 2018, are indicated in the map below, from the U.S. Geological Survey (USGS) WaterWatch for Virginia, accessed online at http://waterwatch.usgs.gov/
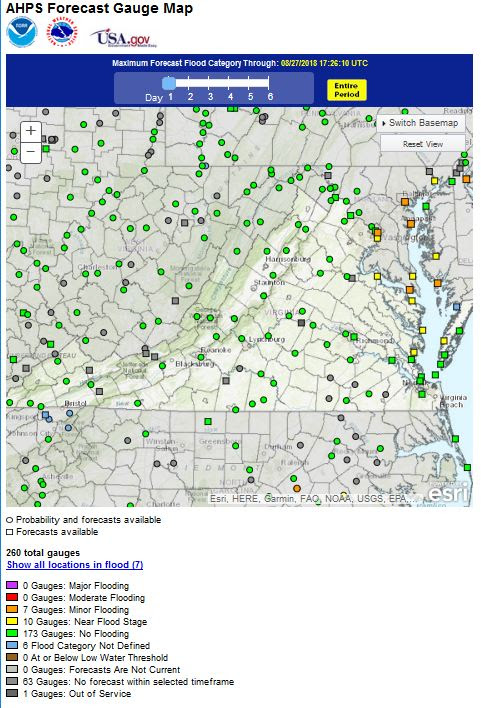
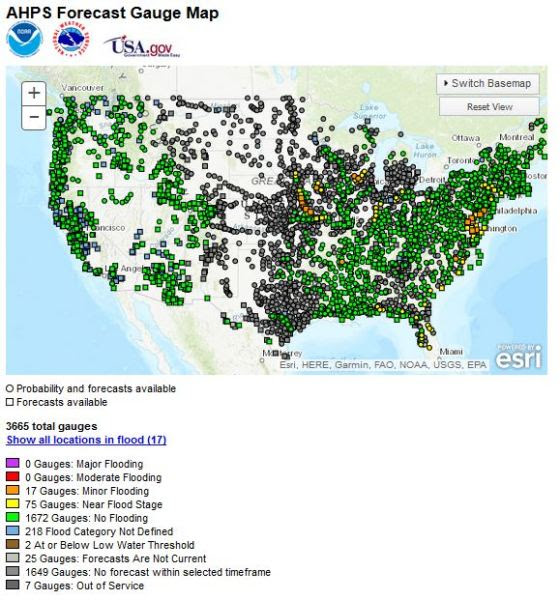
Flooding Overview
As of about 1:25 p.m. EDT on August 21, 2018, 13 stream-gaging stations in Virginia or in nearby areas of adjacent states were experiencing flooding or near flood stage, according to the National Weather Service’s Advanced Hydrologic Prediction Service’s (AHPS) map of stream and river levels relative to flood stage (color-coded) for Virginia and nearby areas. The AHPS map for Virginia is shown below along with the nationwide map as of the same time. The maps are available online at http://water.weather.gov/ahps/
No comments:
Post a Comment